Reconcile Forecast and Actual Before You Chart
A practical checklist for FP&A leads who want variance charts that survive the first question from the CFO.
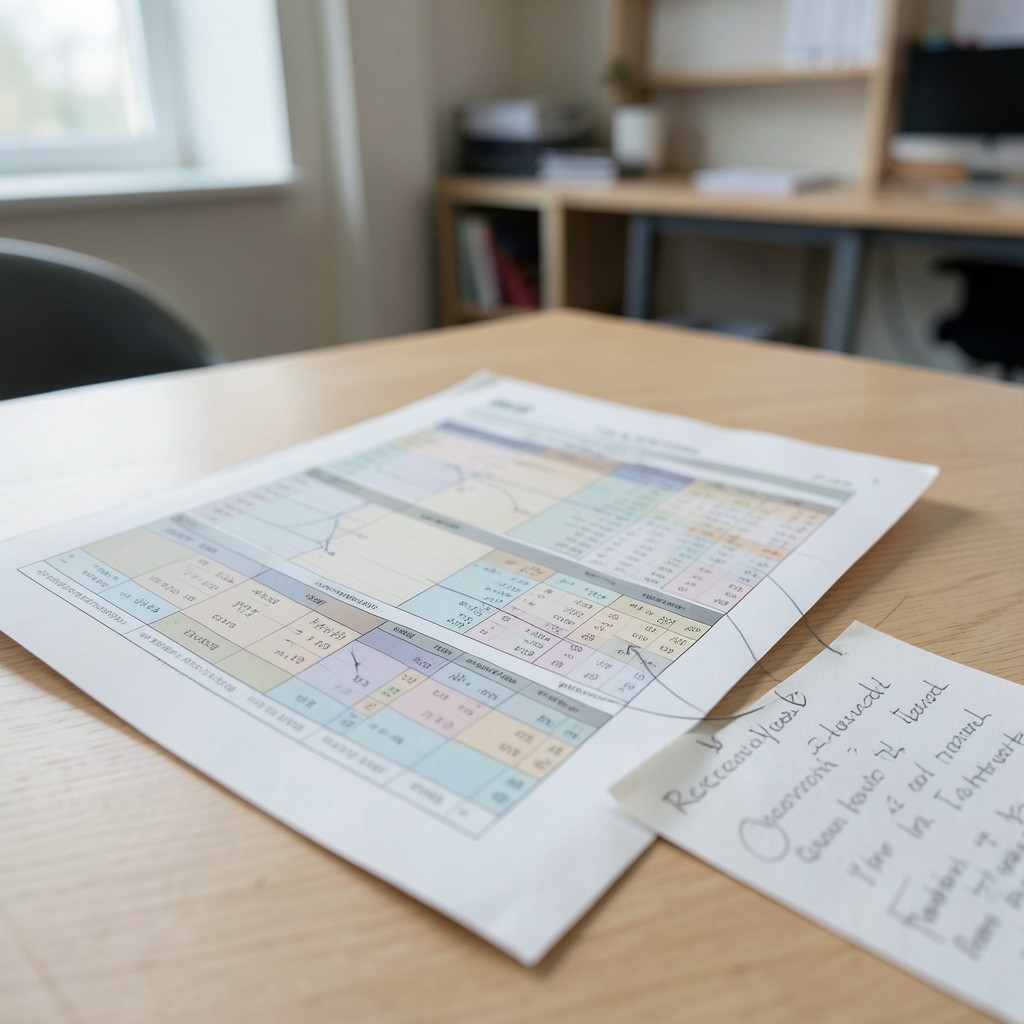
A practical checklist for FP&A leads who want variance charts that survive the first question from the CFO.
Variance charts fail when forecast and actual speak different languages. Before drawing a single bar, confirm that both series share the same chart of accounts mapping, the same intercompany treatment, and the same period cut-off.
Walk this checklist with your FP&A lead: (1) match cost centres for the departments on the dashboard; (2) confirm whether forecast includes vacancies that actual has not filled; (3) decide whether FX is locked at budget rate or restated; (4) document one-offs that belong in a footnote rather than the main variance bar.
Only after those decisions should you compose the visual. A calm forecast-versus-actual view shows absolute variance and percentage side by side, with a short callout for the two largest movers. Everything else stays in the workbook for analysts who want depth.
If reconciliation reveals structural breaks—new entities, changed GL codes—pause the dashboard build. Charts built on broken joins waste board time and erode trust in your financial planning dashboards.